

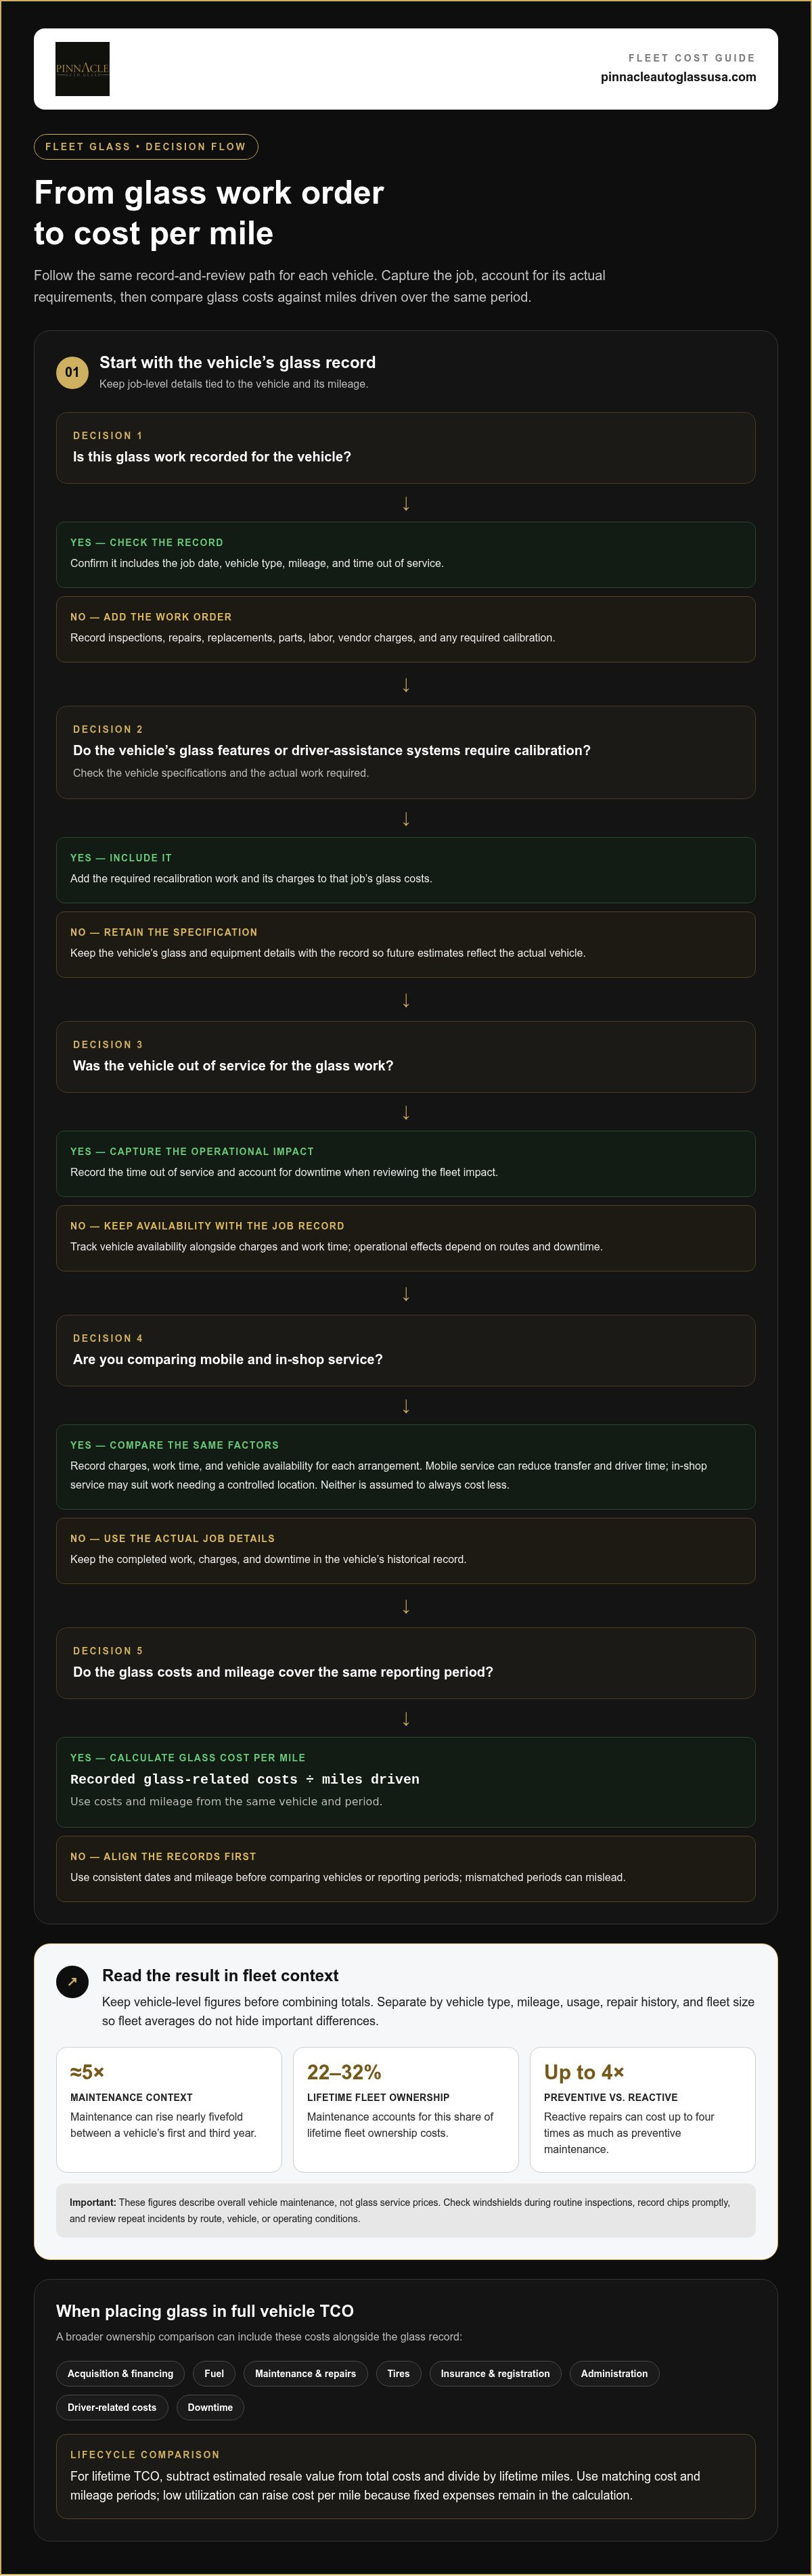
A glass invoice captures only part of a fleet’s glass costs. Calculating total cost of ownership for fleet glass means adding repair and replacement expenses, related ADAS recalibration costs, and the operational impact of vehicle downtime over a defined period. Divide the total by miles driven to estimate glass cost per mile.
Tracking individual jobs is useful, but it may not show the full budget picture. A vehicle off the road can affect productivity, and differences in mileage, usage, and repair history can make fleet averages misleading.
This article explains what to include in a fleet glass TCO calculation, how to estimate cost per mile, and how to use historical records and fleet size to build a practical budget. It also covers how to compare vehicles and identify cost patterns that can inform maintenance planning.
Key Takeaways
- Track glass repairs, replacements, recalibration, and related downtime to understand the full fleet impact.
- Divide glass-related costs by miles driven to compare cost per mile across vehicles and reporting periods.
- Use historical work orders and mileage records to identify recurring cost patterns and build a more practical budget.
- Separate costs by vehicle type, usage, and fleet size so averages don’t hide important differences.
- When fleet windshields need repair or replacement, include the work in your maintenance records to keep future estimates grounded in actual fleet experience.
Maintenance and repair costs
Fleet glass is one part of wider vehicle expenses, including repairs, operating costs, and downtime. A useful estimate separates recurring costs from expenses that vary with vehicle use and damage.
Start with the glass-related work recorded for each vehicle: inspections, repairs, replacement jobs, parts, labor, vendor charges, and any required calibration. Track dates, vehicle type, mileage, and time out of service. Then consider glass costs alongside fuel, tires, routine maintenance, and other unexpected repairs. Maintenance can rise nearly fivefold between a vehicle’s first and third year, while maintenance accounts for 22-32% of lifetime fleet ownership costs. Those figures describe overall vehicle maintenance, not glass service prices.
Variable Glass Service Expenses
Variable glass expenses change with damage, vehicle use, and service arrangements, so they can shift between reporting periods. Mobile service can reduce vehicle transfer and driver time, while in-shop service may suit work that needs a controlled location. The operational effect depends on routes and downtime. Compare options by recording charges, work time, and vehicle availability, without assuming either always costs less.
Vehicle Features and Calibration Costs
Vehicle type, windshield features, and driver-assistance systems determine which parts and work a repair or replacement involves. Record each vehicle’s glass specifications and whether its equipment requires ADAS recalibration, so estimates reflect the actual job. OEM, OEE, and aftermarket labels describe different sourcing or specification categories, not a guaranteed quality ranking. Compare compatibility, required features, and calibration needs, as costs vary with the job and supplier.
State requirements can affect windshield condition and replacement decisions. Fleet policies should account for the states where vehicles operate and apply relevant requirements to repair, replacement, and job records.
Prevention Practices and Cost Reduction
Prevention means identifying damage early and reducing avoidable exposure, which can limit repair escalation and operational disruption. Include windshield checks in routine vehicle inspections, record chips promptly, and review repeat incidents by route, vehicle, or operating conditions. Preventive maintenance can reduce long-term repair costs and extend vehicle lifespans; reactive repairs can cost up to four times as much as preventive maintenance. Use these practices to pursue savings without assuming every glass issue is preventable.
Glass is only one part of the annual fleet budget. Include acquisition and capital costs, financing, insurance, licensing, administration, fuel, and downtime. Telematics can help managers review utilization, fuel performance, driver behavior, and predictive maintenance. For lifecycle estimates, account for depreciation, subtract expected residual value, and include disposal costs when vehicles leave the fleet. This wider view connects glass decisions to each vehicle’s operating and replacement costs.
Fleet total cost of ownership and cost-per-mile calculations
Fleet managers need a consistent way to compare vehicles with different uses and ownership periods. Total cost of ownership (TCO) combines direct and indirect expenses from acquisition through operation, maintenance, and disposal. Calculate it over one year or the vehicle’s full operating life, then normalize the result by miles or time.
Build a comparable cost picture
Include acquisition and financing, fuel, maintenance, repairs, tires, insurance, registration, administration, driver-related costs, and downtime. Subtract estimated resale value from total costs. This makes a vehicle with higher upfront acquisition costs comparable to one with heavier operating expenses. Terrain, weather, payload, mileage, and city or highway use can all affect the result.
Cost-per-mile normalization makes vehicles with different lifecycles easier to compare. Divide annual TCO by annual miles for an annual rate, or lifetime TCO by lifetime miles for a full-life rate. Use the same cost categories and period for each vehicle. Fixed expenses remain in the calculation even when a vehicle travels fewer miles, so low utilization can raise its cost per mile.
Calculate the cost per mile
For an annual view, use: annual TCO ÷ annual miles driven = annual cost per mile. For a lifetime view, use: total lifetime costs minus estimated resale value, divided by lifetime miles. Keep the costs and mileage periods aligned, or the comparison may mislead.
Benchmarks can provide context, not a substitute for fleet records. Cited total-cost benchmarks are 38.2 cents per mile for Class 8 tractors, 49.7 cents per mile for Class 6 and 7 trucks, 15.9 cents per mile for reefer trailers, and 20.0 cents per mile for dry van trailers. Different vehicle classes and operating patterns make direct comparisons limited.
Use results to guide fleet decisions
Compare annual and lifetime results to identify whether a vehicle’s costs come from fixed expenses, usage, or downtime. Apply the same method to fleet glass: divide recorded glass-related expenses by miles driven over the same period. Keep vehicle-level records before combining fleet totals, so a high-use truck does not conceal differences among vehicles.
For glass work, the estimate depends on vehicle type, glass features, required work, and calibration needs. The exact figure for your case is provided in a quote. Record completed work alongside mileage to keep future comparisons accurate. Fleet glass records can help connect service activity with broader cost-per-mile analysis.
TCO calculation using historical fleet data
Historical records turn TCO from a forecast into an estimate grounded in fleet experience. Use consistent vehicle, service, and mileage records throughout the lifecycle to see where costs accumulate.
Collecting and Accumulating TCO Data
Cost accumulation means bringing purchase, operating, maintenance, repair, and disposal records together for each vehicle. Consistent records help fleet managers compare actual expenses and identify missing cost categories. Capture each transaction’s date, vehicle identifier, odometer reading, expense type, and operating context. Include purchase price, financing, fuel, maintenance, insurance, vendor charges, and downtime where applicable.
Separate costs by vehicle and reporting period before calculating fleet totals. For example, keep a windshield repair entry distinct from routine servicing, then link both to the vehicle’s mileage and lifecycle. This improves comparisons and shows whether a change reflects vehicle use or a different maintenance pattern.
Using Historical Cost Data
Historical cost data shows how actual maintenance costs and vehicle use compare with the original estimate. Review records by vehicle age, mileage, class, route, and duty cycle. Rising maintenance costs as a vehicle ages may change its projected lifecycle expense, while repeated repairs on one route may point to a pattern worth investigating.
Use prior periods to build the next estimate, then add a contingency based on fleet history and relevant benchmarks. Keep assumptions visible: purchase price, annual mileage, expected service needs, and planned ownership period. Review the estimate annually and update it when actual use or costs change.
Third-Party TCO Data Resources
External TCO benchmarks provide comparison points when a fleet lacks a long internal record or wants to test its assumptions. Match benchmarks to vehicle class, operating conditions, and cost categories before using them. A broad vehicle average may not reflect the fleet’s payload, terrain, routes, or maintenance practices.
Treat outside figures as context, not a substitute for internal vehicle cost records. Compare definitions first: one source may include downtime, while another focuses on maintenance and repairs. Record the source period and included expenses beside each benchmark, so future reviewers can understand the comparison.
A useful TCO analysis combines the fleet’s own history with carefully matched external data. If a vehicle’s records show more frequent repairs than the benchmark, investigate the difference before changing the forecast. Check whether mileage, duty cycle, or expense coding explains the gap. Then revise the estimate and retain the previous assumptions for comparison.
For glass tracking, log each service event with the vehicle, date, mileage, work category, and downtime. Review this history alongside broader maintenance and operating expenses. Consistent entries help managers compare vehicles over the same period and refine future budgets without treating an unusual repair as a lasting trend.
Small- and large-fleet budgeting
TCO analysis helps fleet managers turn vehicle expenses into an annual budget. Fleet size and mileage shape how they track costs, allocate funds, and compare vehicles.
Planning Fleet Budgets With TCO
TCO-based budgeting uses expected lifecycle expenses to guide spending and fleet decisions. Incomplete cost tracking can leave an organization short of funds for maintenance, repairs, fleet management, or driver training. Review estimates annually, then update assumptions for mileage, fuel costs, maintenance, insurance, and downtime. Track cost components separately to show which expenses drive changes.
Fleet Size and Mileage Effects
Fleet size affects the volume of service records, while annual mileage affects exposure to road use and operating costs. More miles can mean more opportunities for glass damage, but route, terrain, weather, vehicle type, and duty cycle also influence risk. Track glass incidents against mileage and vehicle count to distinguish usage patterns from one-off events.
Annual fixed costs apply whether a vehicle travels 5,000 miles or 50,000 miles in a year. That difference changes the cost per mile because the same fixed expense is spread across different mileage totals. Glass work is often recorded as a variable expense, so compare its history with vehicle mileage and fleet activity rather than assuming fleet size alone predicts damage.
Small fleets, defined as fewer than 50 vehicles, can start with a vehicle-level ledger or spreadsheet. Record each glass event, mileage, date, downtime, and expense category. Group similar vehicles or operating roles only after preserving individual records. This makes an estimate easier to update and helps prevent one vehicle’s unusual repair history from distorting the fleet average.
Larger fleets can organize tracking by vehicle class, location, route, or duty cycle. Telematics can provide insight into utilization, fuel performance, driver behavior, and predictive maintenance. Use those views alongside service records, not instead of them. Separate glass entries from broader maintenance costs, then compare them across operating groups and annual periods.
Budget planning should connect analysis to decisions. TCO can inform asset lifecycle management, vehicle selection, vendor selection, and lease-versus-buy comparisons. For glass budgets, use historical work orders to estimate expected activity, then set aside a contingency based on past fleet costs and relevant benchmarks. Revisit the estimate during the annual review when mileage, routes, or vehicle mix changes.
Consistent categories make small- and large-fleet budgets easier to compare. Align mileage periods, record changes in vehicle use, and review actual spending against the estimate. This helps managers identify whether a budget difference reflects higher utilization, changing operating conditions, or a shift in repair frequency.
Fleet total cost of ownership calculation
A useful fleet TCO calculation connects acquisition, operations, maintenance, downtime, and disposal across a vehicle’s lifecycle. For meaningful comparisons, use the same ownership period, cost categories, and mileage basis for every vehicle. This clarifies how each cost component affects efficiency and replacement decisions.
Set the calculation boundary first. Use the expected ownership or lease period, commonly three to five years, and include direct and indirect costs between purchase and sale. Add acquisition, financing, fuel, maintenance and repairs, insurance, registration, administration, driver-related expenses, and downtime. Subtract expected resale proceeds. Include disposal costs separately when they are part of the fleet’s records.
For a standard commercial van driven 100,000 miles annually for five years, its lifetime mileage reaches 500,000 miles. Keep the residual treatment consistent: don’t subtract it twice if the total already reflects that deduction.
To isolate glass, apply the same method to glass-related work orders. Add recorded repair, replacement, recalibration, vendor, and downtime expenses for the chosen period, then divide by miles driven during that period. Keep this figure separate from whole-vehicle TCO, so managers can compare glass trends without confusing them with fuel or depreciation. Use vehicle-level records before calculating a fleet-wide average.
Compare vehicles only after aligning class, use, period, and mileage. A high-use truck may spread fixed annual expenses across more miles, while low utilization can raise its cost per mile. Terrain, weather, payload, and duty cycle also affect the result. A five-year comparison works for some assets, while a three-year horizon may better match a shorter planned lifecycle.
Fleet software can organize purchase records, mileage, work orders, and downtime, but the calculation still depends on consistent categories. Review assumptions annually and update expected mileage, resale value, and operating costs as actual records change. Use the result to compare repair-versus-replacement projections over the same three-year period, rather than judging a vehicle from one invoice.
For glass costs, the clearest takeaway is to track each event against vehicle mileage and report the result separately from overall TCO. This supports comparison across vehicles and helps show where glass-related downtime affects operating efficiency. Plan fleet glass cost tracking alongside your broader vehicle analysis.
Pinnacle Auto Glass: Windshield Replacement
Pinnacle Auto Glass helps fleet operators address windshield damage with repair or replacement. For vehicles with ADAS, we recalibrate the system after windshield replacement to ensure safety features function properly. Fleet, Commercial & RV Services support fleet glass needs, including commercial truck glass.
Include each glass job in your fleet records with the vehicle, mileage, work completed, and downtime. Consistent entries help you compare actual glass-related expenses across vehicles and refine future TCO estimates. Turn to Pinnacle Auto Glass when fleet windshields need attention or when you are organizing glass work for commercial vehicles.
Contact Pinnacle Auto Glass or visit pinnacleautoglassusa.com to discuss your fleet glass needs.
Make Your Next Fleet Review More Useful
Make your next fleet review a decision point. Assign responsibility for keeping glass work orders and mileage records consistent, then use those records to spot changes in service patterns. A repeatable method for calculating total cost of ownership for fleet glass can help your team distinguish a one-time incident from a trend that deserves attention.
Connect each recorded job to the work performed. Pinnacle Auto Glass offers Windshield Repair, Windshield Replacement, and ADAS System Recalibrations, giving fleet operators relevant service options when glass damage affects a vehicle. Clear records also help your team assess how each job fits its operating plan.
Build the tracking routine around the way your fleet operates, and refine it as vehicle use changes. For help with a fleet glass need, contact Pinnacle Auto Glass. A consistent process can make your next budgeting decision clearer and more actionable.
Frequently Asked Questions
What is total cost of ownership?
Total cost of ownership is the full economic cost of holding and using an asset throughout its lifecycle. For a vehicle, that means looking beyond the purchase transaction to ongoing expenses and eventual resale or disposal. A vehicle’s purchase price alone, for example, will not show whether lower fuel use offsets higher maintenance. TCO gives decision-makers a broader basis for assessing value and comparing choices.
What is Fleet TCO?
Fleet TCO is the combined ownership and operating cost of fleet vehicles over a selected period. Managers can calculate it for one vehicle, a vehicle class, or the fleet as a whole. For example, comparing two delivery vans is more useful when both estimates cover similar routes and usage. Fleet-level results can guide asset planning, budgeting, and replacement decisions without concealing individual vehicle differences.
What costs should be considered?
Consider costs from acquisition through disposal, including financing, fuel, insurance, registration, administration, driver-related expenses, maintenance, repairs, tires, vendor charges, and downtime. Account for resale proceeds when estimating net lifecycle cost. A vehicle used for frequent short urban trips may have a different expense pattern from one on steady highway routes. Keep each category visible so managers can identify what changed between estimates.
Why is calculating TCO important?
Calculating TCO helps managers compare the financial impact of keeping, replacing, leasing, or buying vehicles. It can reveal expenses that a purchase-only comparison misses, such as downtime or changing maintenance needs. A vehicle with a lower acquisition cost, for example, may still create higher operating expenses over its service life. TCO also supports more complete budgets and gives teams a consistent basis for reviewing decisions.
What costs are included in fleet glass total cost of ownership?
Fleet glass TCO includes recorded glass repair and replacement expenses, related parts and labor, required ADAS recalibration, vendor charges, and downtime linked to the work. Attach each event to the vehicle and its mileage. For example, record a repair separately from a replacement, since the work performed and calibration requirements can differ. This helps managers distinguish glass expenses from other vehicle maintenance.
How do insurance deductibles, coverage, and claims affect fleet glass expenses?
Insurance affects what the fleet pays directly and what it submits through a claim. Compare the applicable deductible with the covered repair or replacement expense, and record claim-related costs separately. Coverage terms and claim history can influence the fleet’s actual outlay, so use policy documents and completed claim records when building estimates. Do not count an insurer payment and the original invoice as separate fleet expenses.
How can fleets estimate downtime and productivity costs from glass damage?
Estimate downtime by recording how long each affected vehicle is unavailable and what work it would have completed. Apply the fleet’s own measure of lost productivity, then include substitute vehicle or idle driver impacts where relevant. For example, a dispatch log can show whether another vehicle covered the route or deliveries were delayed. Refine the method using completed incidents rather than treating every vehicle’s downtime impact as identical.
What data and formula should fleet managers use to compare glass vendors and calculate TCO?
Use work orders, invoices, vehicle identifiers, mileage, service dates, work type, calibration details, and downtime records. To calculate glass cost per mile, divide eligible glass-related expenses for the selected period by miles driven during that same period. Compare vendors using consistent job categories and operational impacts, not invoice totals alone. A practical way of calculating total cost of ownership for fleet glass is to preserve those records by vehicle and review them regularly.


